The U.S. online grocery market finished June with $7.1 billion in total sales, down 1.2% compared to last year’s $7.2 billion, according to the latest monthly Brick Meets Click/Mercatus Grocery Shopping Survey. Although more households bought groceries online in June than last year, these users completed fewer orders during the month and average order values (AOV) had mixed results across the segments.
“To elevate customer engagement, regional grocers need to improve the perceived value associated with the online shopping experience,” says Sylvain Perrier, president and CEO, Mercatus. “To achieve this, grocers can focus their efforts on areas like leveraging personalized recommendation algorithms to provide more relevant product suggestions based on individual preferences and past purchases, optimizing the platform’s usability to reduce points of friction, and offering personalized discounts, digital coupons, and loyalty rewards.”
“Our 5-year forecast anticipated that 2023 would be a challenging year for eGrocery so these results generally align with our expectations,” says David Bishop, partner at Brick Meets Click. “So, while Ship-to-Home declines and Delivery has mixed results, Pickup’s stronger performance isn’t surprising as it is becoming more widely available and helps customers who want to shop online save money, which is certainly helpful in the current market.”
From Brick Meets Click:
- The number of monthly active users (MAUs) buying groceries online expanded by slightly more than 1% in June and the overall average order value (AOV) rose 3% vs. a year ago, however, neither of these gains was great enough to offset the more than 5% drop in the average number of orders completed during the month.
- In addition, a greater number of MAUs, nearly 70%, chose to use just one of the three fulfillment methods to receive their online grocery orders, up over 200 basis points (bps) compared to the prior year. Pickup’s penetration rose 140 bps to 56% while ship-to-home’s fell 390 bps to 41%, and Delivery dipped 250 bps to 39%.
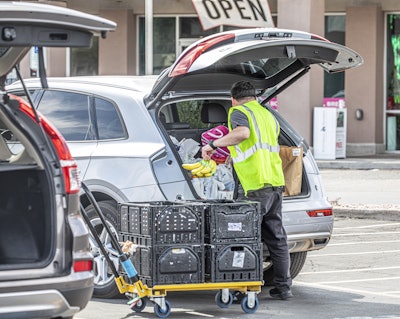
- Pickup, much like last month, continued to buck the downward trend experienced by the other two segments. In June, pickup sales grew 3.2% vs. a year ago and accounted for nearly 49% of all e-grocery sales, up 200 bps from last year. Sales climbed largely due to an MAU base that expanded almost 4% during the month although its AOV slipped 40 bps on a year-over-year basis.
- Delivery dipped for the second straight month. The segment’s sales declined 2.5% compared to June last year, causing its sales share to fall by 50 bps to just under 35%. A 5% contraction in MAUs during the month drove most of the sales decline as delivery’s AOV increased by more than 7% versus last year.
- Ship-to-home continues to face headwinds as U.S. households continue to shift how they receive online grocery purchases. The segment experienced a 9.7% drop in sales compared to June last year, capturing just under 17% of all e-grocery purchases during the month, a drop of 150 bps vs. a year ago. Lower spending per order was also a factor as its AOV fell 1% on a year-over-year basis.
- Online’s share of total grocery spending declined in June, dropping 230 basis points to 11.9% vs. last year. Excluding ship-to-home, since most conventional supermarkets don’t offer it, the adjusted contribution from pickup and delivery finished at 10%, down 160 basis points compared to a year ago, due to delivery’s weaker performance for the month.
- For the first six months of 2023, total e-grocery sales were down 1.8% vs. the same period in 2022. Pickup sales were up 1.3%, delivery sales were down 2%, and ship-to-home sales fell 9%. As a result, e-grocery’s year-to-date contribution to total grocery sales fell 100 bps to 12.3% compared to 2022.


