Consumer packaged goods spending jumped 27% year-over-year in October, the largest year-over-year percentage increase since April and up a strong 9% over September 2020 according to data just released by NCSolutions (NCS), the leading company for improving advertising effectiveness for the consumer packaged goods ecosystem.
Hand sanitizer, which was up 465% in October 2020 as compared to October 2019, continues to be a top-growing category. Other top-growth categories for the month compared to last year are gum (388%), shelf-stable convenient breakfasts (373%), premixed alcohol cocktails (167%) and refrigerated wraps (108%).
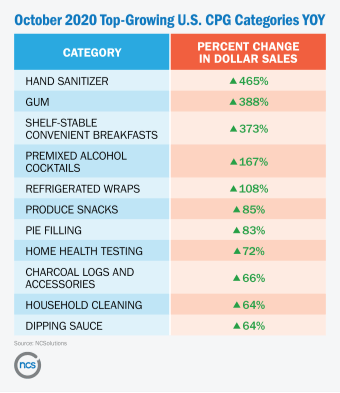
Americans have also increased their spending on items related to the coming winter months and preparation for the flu season. Year-over-year spending increased on home health testing (72%), such as thermometers and blood pressure kits, and charcoal logs and accessories (66%) in October.
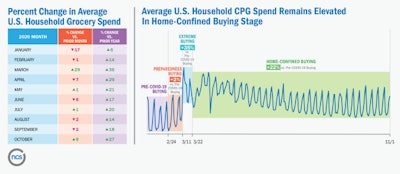
“Early in the pandemic, Americans stocked their pantries in the face of stay-at-home and lock-down orders. After the peak of this Extreme Buying phase, the level of CPG spending began to drift downward. However, year-over-year elevated spending has been consistently in the double digits throughout the Home-Confined phase. The high in March was 36%; the lowest it dropped to was in August — at 14%,” said Linda Dupree, CEO, NCSolutions. “Since then, we’ve experienced periodic increases in grocery spending, mostly due to growing consumer angst about supply chain issues, the ability to source foods in restaurants and stay-at-home orders that keep people closer to home. These consumer concerns coupled with the increase in COVID-19 cases – are what will drive spending behaviors over the coming winter.”
“We’ve seen CPG brands react to the pandemic with their advertising in a variety of ways— everything from pausing their campaigns to accelerating in order to take advantage of upended shopping habits,” said Lance Brothers, chief revenue officer, NCSolutions. “The bottom line, in both boom and bust times, is that advertising works and is vital to the fabric of brands. A key to retaining loyal shoppers and maintaining -- or even growing -- market share is a continued relationship with consumers. This is especially true during times of market disruption.
NCS Tracks Pandemic-Related Buying Month-by-Month
The composition of Americans’ grocery carts shifted in October, as consumers purchased more hot foods – such as hot cocoa, tea and hot cereal. Preparations for the Thanksgiving holiday also played a role in what was added to their carts, as items such as pie filling, gravy and stuffing moved up in the rankings.
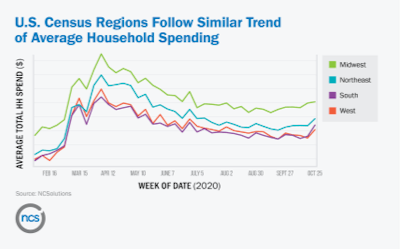
Household spending on consumer packaged goods has followed the same trajectory across regions during the pandemic — rising and falling at the same points — but there are distinct differences in average household spend, grocery basket size and number of trips.
One Nation but Regional Differences On Display as Consumers Gear Up For Thanksgiving Celebrations
NCS’ new Thanksgiving consumer survey exposes regional variations in planned celebrations and grocery shopping patterns among American adult consumers.
Midwest
- Midwesterners really don’t like Brussels sprouts — 47% consider it to be their least favorite Thanksgiving food (compared to the 41% national average)—but they do love stuffing and dinner rolls more than others
- A lower percent of Midwesterners plan to celebrate Thanksgiving at home (52%) compared to 58-61% in other regions
- They plan to gather in the greatest group sizes (22% plan to gather in groups of 10 or more compared to the 20% national average)
- Midwesterners are brand loyal — only 7% plan to try new products this Thanksgiving season compared to 10% in other regions
Northeast
- Nineteen percent of Northeastern consumers plan to spend more this Thanksgiving compared to the 13-15% of other regions
- Northeastern consumers are more serious about turkey, apple pie, cranberry sauce and seafood than the rest of the nation
- When it comes to buying healthy foods, 34% of consumers in the Northeast lead the pack compared to the national average (28%)
- Some 20% of Northeastern consumers plan to spend more on cleaning supplies compared to the 16% national average
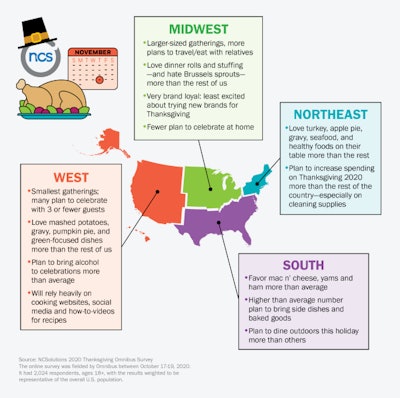
South
- Southerners’ love of yams, mac n’ cheese and ham for Thanksgiving is tops in the nation
- Nearly half (47%) of Southerners plan to bring a side dish to holiday gatherings compared to the national average (42%) and just one in three Northeasterners
- What else will Southerners bring to their Thanksgiving dinners? Baked goods (42%) is high on the list compared to the 36% national average
- A greater percentage of Southern and Western consumers plan to dine outdoors this holiday (12%) compared to 4% of Midwesterners and 9% of Northeasterners
West
- Westerners and Midwesterners love their mashed potatoes, gravy, pumpkin pie, green bean casserole, and other green vegetable dishes more than any other region
- They will gather in the smallest group sizes this year, with 31% of Westerners planning to have Thanksgiving meals of one-to-three people compared to the 27% national average
- With smaller gatherings and more cooks this year, 39% of Westerners plan to consult cooking sites and 27% will leverage social media for cooking ideas—greater than the national average
- One in four consumers in the West plan to bring alcohol to Thanksgiving celebrations, significantly more than the national average of 18 percent
