While August restaurant trends reflect an environment in which slightly less than 25% of restaurant units were under restrictions for on-premises dining during the course of the month, similar to June and July, the rate of traffic and dollar declines for the month eased slightly to -10% and -9%, respectively, compared to same period year ago, reports The NPD Group.
"As the summer progressed and mandated restrictions were lifted, an increasing number of consumers became more comfortable dining out based on the safety protocols restaurants put in place," says David Portalatin, NPD food industry advisor and author of Eating Patterns in America. "After months of staying at home and cooking their own meals or ordering in, they were ready for the restaurant experience again."
Since April, at the height of the stay-at-home and mandated dine-in closures, there are several areas of the restaurant industry that have improved or returned closer to pre-pandemic levels over the last months, according to NPD's CREST foodservice market research, which daily tracks how U.S. consumers use restaurants and foodservice outlets. For example:
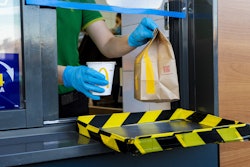
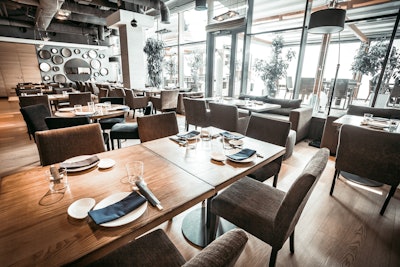
- On-premises visits have improved every month since April as the mandated dine-in closures have lifted and restaurants were able to offer varying levels of dine-in capacity.
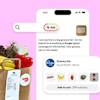
- Digital orders accounted for over 20% of all restaurant occasions in April, but is down to 17% of occasions in August.
- Dealing, a buy-one-get-one-free or other type of deal, was utilized in 30% of occasions in April but has slowed share growth every month since, and represented 27% of occasions in August.
- Adult-only parties have steadily improved share over the last several months. In August, adult-only parties represented 63% of all restaurant occasions and parties with kids (families in most cases) represented 37%. In April, adult-only parties represented 59% of visit share and parties with kids 41% share.