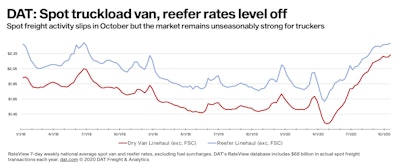
The spot truckload freight market showed signs of cooling last week as freight volumes continue to level off from all-time highs.
The number of spot load posts decreased 5% during the week ending Oct. 25, marking four straight weeks of declines, said DAT Freight & Analytics, which operates the industry’s largest load board network. Truck posts increased by 3%.
Rates and volumes may have hit a plateau but they remain in record-setting territory. The number of available loads is more than double this time last year. Despite a 4% decline week over week, van load posts are up 132% compared to the same period in 2019.
National Average Load-to-Truck Ratios
An increase in truck posts and decrease in freight pushed down load-to-truck ratios for all equipment types last week:
- Van LT ratio = 4.0, down from 4.2 the previous week.
- Reefer LT ratio = 7.7, down from 8.3, driven by a 6% drop in load posts.
- Flatbed LT ratio = 33.9, down from 37.2. Load posts fell 5%.
National Average Line-Haul Rates
National average spot line-haul rates (not including a fuel surcharge) remain elevated through Oct. 25 and have been within a narrow price range since the start of the month.
- Van: $2.22 per mile excluding a fuel surcharge
- Reefer: $2.38 per mile
- Flatbed: $2.23 per mile
Including a calculated fuel surcharge would add approximately 19 cents. Spot rates are one-time transactions and will vary from load to load and lane to lane.
Trends to watch
Urgency to move CPG and other retail goods
Demand for fast-moving consumer goods continues to drive the van freight market. IRI, a research firm that specializes in consumer packaged goods, retail, and over-the-counter health care markets, said that while CPG sales are up 8% year over year the e-commerce portion of that activity is up 34%. CPG and other retail freight continue to present opportunities for dry van carriers on the spot market.
A surge in imports traffic
West coast ports are bracing for record imports. Trucks are tight in Los Angeles and Ontario, Calif., and a wave of container freight in the coming weeks will stretch capacity further. The number of available loads in Los Angeles jumped 25% week over week, while Ontario volumes increased by 19%. Look for more upward pressure on spot rates in Southern California.
Reefer freight from the “salad bowl”
Around 90% of all leafy vegetables grown in the U.S. originate in the region around Yuma, Ariz., and California’s Imperial Valley, giving the area the nickname of the nation’s “winter salad bowl.” Most production takes place from November through March, with harvests packed at local salad-processing plants and shipped to major supermarket and fast-food chains. The average spot line-haul rate from the southern Arizona border market jumped by 17 cents to $2.29 a mile last week excluding fuel. Month over month, volumes are up 54%. The salad bowl is starting to roll.
Slowing East Coast reefer volumes
In other signs of reefer market seasonality, we’re seeing early reports of fall vegetables out of Florida. Reefer volumes from Miami were up 22% week over week and Jacksonville increased 16%, but loose capacity has suppressed outbound rates. Loads from Atlanta dropped 21% week over week although tighter capacity pushed the average line-haul rate up 3 cents to $2.30 a mile. Reefer volumes from Elizabeth, N.J., fell 10% compared to the previous week and the average outbound line-haul rate dropped a penny to $2.13 a mile.
Impact of rail surcharges on truckload demand
In Seattle, Union Pacific is doubling a $500-per-container surcharge on small shippers to move excess contract cargo by rail and intermodal. As a result, Seattle outbound spot truckload volume increased 21% week over week and nearly 17% of those loads were destined for Los Angeles and Ontario.
Disruptive weather
It’s late October, which means weather is a hot topic. A winter storm is forecast for the southern Rockies and Southern Plains, Santa Ana winds and wildfires are affecting travel in Southern California, and Hurricane Zeta is threatening the Gulf Coast. Watch the weather—and be careful out there.
DAT operates the industry’s largest network of load boards and data analytics service. Rates are derived from DAT RateView, a database of $68 billion in actual spot market transactions each year. DAT monitors an additional $50 billion in contract freight transactions for subscribers to its Freight Market Intelligence Consortium (FMIC).


