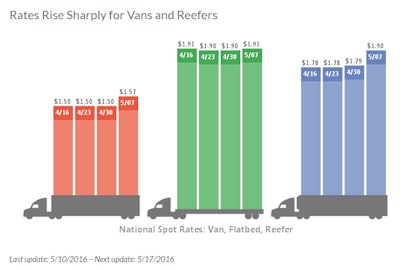
Truckload rates on the spot market increased sharply for all three equipment types during the first week of May, reported DAT Solutions, which operates the DAT network of load boards.
Driven by demand for refrigerated and dry vans, the number of loads posted on DAT boards was up 5.1 percent compared to the previous week.
The national average spot reefer rate was up 11 cents to a national average of $1.90 per mile, as the number of posted reefer loads increased 11 percent. Reefer truck capacity gained 5 percent, pushing the load-to-truck ratio up 6 percent to 3.4 loads per truck. That means there were 3.4 available loads for every reefer posted on the DAT network.
Outbound reefer freight volumes and rates surged in Florida, with Lakeland up 29 cents to an average of $1.91 a mile and Miami adding 23 cents to an average of $2.32 a mile. Miami-to-Baltimore jumped 41 cents to an average of $2.62 a mile.
Van load posts rose 11 percent and the number of available trucks was virtually unchanged. That pushed the van load-to-truck ratio up 11 percent to 1.8 loads per truck. The national average spot market rate for vans added 7 cents to $1.57 per mile, including a 2-cent rise in the average fuel surcharge.
Hot van markets by region are:
- South Central: Houston, $1.49/mile, up 5 cents
- Southeast: Charlotte, $1.77/mile, up 2 cents
- West: Los Angeles, $1.89/mile, up 3 cents
- Northeast: Allentown, Pa., $1.76/mile, up 4 cents
- Midwest: Chicago, $1.73/mile, up 1 cent
Flatbed load volume was unchanged while capacity increased 12 percent from the previous week. That led to an 11 percent decline in the load-to-truck ratio, from 21.1 to 18.8 loads per truck. The national average flatbed rate added 1 cent to $1.91 a mile.
Rates are derived from DAT RateView, which provides real-time reports on prevailing spot market and contract rates, as well as historical rate and capacity trends. All reported rates include fuel surcharges.
Load-to-truck ratios represent the number of loads posted for every truck available on DAT load boards. The load-to-truck ratio is a sensitive, real-time indicator of the balance between spot market demand and capacity. Changes in the ratio often signal impending changes in rates.
For complete national and regional reports on spot rates and demand, visit dat.com/Trendlines. DAT Trendlines is a weekly report on spot market freight availability, truck capacity, and rates.