Spot-market freight volume edged down 3.4 percent in April, compared to March, in a typical seasonal pattern, according to the DAT North American Freight Index.
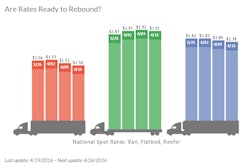
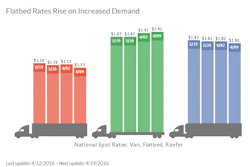
Spot truckload freight availability in April declined 8.9 percent for dry vans, volume for refrigerated ("reefer") vans slipped 9.4 percent, and flatbed volume increased 3.9 percent. Line-haul rates on the spot market declined 1.5 percent for vans, and 0.6 percent for reefers, but flatbed rates increased 1.2 percent, month over month.
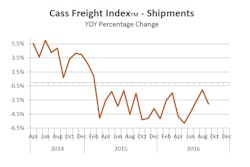
Compared to April 2015, overall spot market freight availability fell 30 percent. Year-over-year declines have been following a consistent pattern in every month since January 2015, due to lower demand for transportation services in the spot market, as well as readily available truck capacity.
Demand declined 38 percent for vans, 34 percent for reefer trailers, and 22 percent for flatbeds, year over year. Line-haul rates fell 16 percent for vans, 12 percent for reefers, and 8 percent for flatbeds in April, compared to same-month levels in 2015.
A 41 percent drop ($0.12) in the fuel surcharge also contributed to the decline in total carrier revenue per mile. The total rate includes both the line haul rate and the surcharge, which is pegged to the retail cost of diesel fuel.
Intermediaries and carriers across North America listed more than 99 million loads and trucks on the DAT Network of load boards in 2015. As a result of this high volume, the DAT Freight Index is representative of the ups and downs in North American spot market freight movement.
Reference rates are the averages, by equipment type, of thousands of actual rate agreements between freight brokers and carriers, as recorded in DAT RateView. Rates are cited for line haul only, excluding fuel surcharges, except where noted. The monthly DAT North American Freight Index reflects spot market freight availability on the DAT Network of load boards in the United States and Canada. Beginning in January 2015, the DAT Index was rebased so that 100 on the Index represents the average monthly volume in the year 2000. Additional trends and analysis are available at DAT Trendlines.