Shippers and brokers posted 4.1 percent more loads during the week ending Feb. 20 while the number of available trucks fell 2.0 percent, according to DAT Solutions, which operates the DAT network of load boards. Falling national average spot rates leveled off compared to recent weeks, indicating the start of a possible rise heading into the Spring.
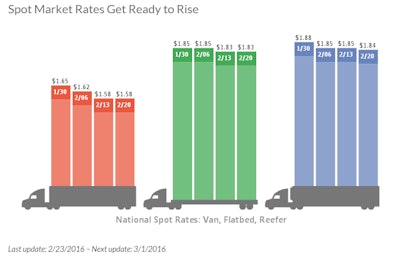
In the van market, load posts increased 4 percent while available capacity declined 3 percent. The van load-to-truck ratio rose marginally from 1.3 to 1.4 loads per truck, meaning there were 1.4 van loads for every truck posted on the DAT network. Compared to the previous week, the national average van rate was unchanged at $1.58 per mile.
Flatbed load volume jumped 10 percent while capacity increased less than 1 percent. That yielded a 10 percent increase in the national flatbed load-to-truck ratio, from 9.6 to 10.6 loads per truck. The average flatbed rate held steady at $1.83 per mile.
The number of reefer load posts declined 6 percent while truck posts added 1 percent last week. As a result, the load-to-truck ratio fell 7 percent, from 3.1 to 2.9 loads per truck. The national average reefer rate fell to $1.83 per mile on a 1-cent fuel surcharge decline.
The national average diesel price was unchanged at $1.98 per gallon. On the spot market, freight brokers usually quote a one-time price that includes both a line-haul portion and a fuel surcharge; as such, declining fuel prices influence spot market rates significantly.
Rates are derived from DAT RateView, which provides real-time reports on prevailing spot market and contract rates, as well as historical rate and capacity trends. All reported rates include fuel surcharges.
Load-to-truck ratios represent the number of loads posted for every truck available on DAT load boards. The load-to-truck ratio is a sensitive, real-time indicator of the balance between spot market demand and capacity. Changes in the ratio often signal impending changes in rates.
For complete national and regional reports on spot rates and demand, visit dat.com/Trendlines. DAT Trendlines is a weekly report on spot market freight availability, truck capacity, and rates.