Spot market freight volume declined 9.7 percent in October, in a common seasonal pattern, according to the DAT North American Freight Index. Although volume fell below same-month levels of the past five years, total volume for the year to-date has exceeded the same period for every year prior to an atypical 2014.
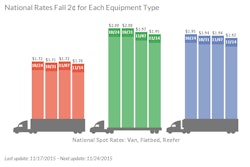
By equipment type, van freight availability declined 13 percent, refrigerated ("reefer") trailers lost 16 percent, and flatbed volume slipped 4.5 percent lower, compared to September. Line haul rates on the spot market followed the month-over-month volume trends by equipment type, declining 2.6 percent for vans, 4.5 percent for reefers, and 1.7 percent for flatbeds.
Compared to record spot market volume of 2014, freight was down 44 percent in October. By equipment type, year over year, van demand was down 42 percent, reefer volume fell 34 percent, and flatbeds dropped 50 percent, compared to October 2014.
Line haul rates declined 5.7 percent for vans, 5.6 percent for reefers and 5.4 percent for flatbeds, compared to October 2014. Total rates paid to the carrier declined by 15 percent year over year, however, due to a 48 percent decline in the fuel surcharge, which comprises a portion of the rate.
Intermediaries and carriers across North America listed more than 120 million loads and trucks last year on the DAT Network of load boards. As a result of this high volume, the DAT Freight Index is representative of the ups and downs in North American spot market freight movement. In 2015, DAT re-formulated the Index with 2000 as the baseline year.
Reference rates are the averages, by equipment type, of thousands of actual rate agreements between freight brokers and carriers, as recorded in DAT RateView. Rates are cited for line haul only, excluding fuel surcharges, except where noted. The monthly DAT North American Freight Index reflects spot market freight availability on the DAT Network of load boards in the United States and Canada. Beginning in January 2015, the DAT Index was rebased so that 100 on the Index represents the average monthly volume in the year 2000. Additional trends and analysis are available at DAT Trendlines.