The number of available loads on the spot truckload market jumped 36 percent during the week ending June 6 and capacity increased just 5.5 percent, according to DAT Solutions, which operates the DAT network of load boards.
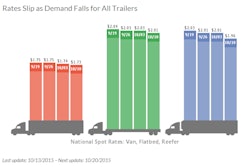
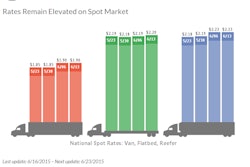
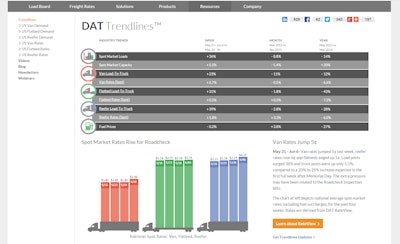
The supply-demand imbalance helped push spot rates up last week. The national average van rate increased 5 cents to $1.90 per mile, the reefer rate rose 4 cents to $2.23, and the flatbed rate edged up 1 cent to $2.19.
Typically, load and truck posts increase 20 percent to 25 percent after a holiday-shortened workweek. The capacity pressure may have been related to carriers parking trucks during Roadcheck, the commercial vehicle inspection blitz on June 2 to 4.
In the van market, DAT reported that load posts were up 32 percent but truck posts were up only 7.5 percent. The imbalance sent the national van load-to-truck ratio up 23 percent to 3.0, meaning there were 3.0 available van loads for every truck posted on the DAT network. Average outbound van rates rose in several key markets including Los Angeles, up 8 cents to $2.17 per mile, and Atlanta, up 11 cents to $2.17 a mile.
Demand for reefers increased 37.5 percent and capacity lost 1 percent; the load-to-truck ratio surged up 37.5 percent to 7.3 reefer loads per truck. Rates continue to trend down in Florida but outbound rates are rising along the Mexican border in Texas and Arizona.
Flatbed load availability rose 38 percent but capacity added just 5.5 percent. The resulting load-to-truck ratio climbed 31 percent to 30.0 flatbed loads per truck.
Load-to-truck ratios represent the number of loads posted for every truck available on DAT load boards. The load-to-truck ratio is a sensitive, real-time indicator of the balance between spot market demand and capacity. Changes in the ratio often signal impending changes in rates.
Rates are derived from DAT® RateView, which provides real-time reports on prevailing spot market and contract rates, as well as historical rate and capacity trends.
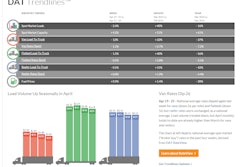
For complete national and regional reports on spot rates and demand, visit dat.com/Trendlines. DAT Trendlines is a weekly report on spot market freight availability, truck capacity, and rates.