Truckload freight volumes reached new heights last month as surging retail imports and peak produce shipments drove demand for transportation services.
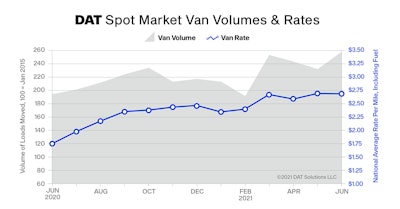
According to DAT Freight & Analytics, the DAT Truckload Volume Index was 237 in June – an 11% increase compared to May, making it a record high.
Meanwhile, rates remain near all-tigh highs. The national average rate for van loads was $2.68 per mile in June, down just one cent from May. In addition, the national average spot rate for refrigerated freight fell one cent to $3.10 per mile month-over-month while the flatbed rate increased three cents to $3.15.
“While the number of trucks posted to the DAT load board network increased significantly in June, overall demand accelerated at a faster pace. The typical seasonal decline in contract and spot rates from now to Thanksgiving looks less likely in 2021,” says Ken Adamo, Chief of Analytics at DAT.
Per DAT:
- Overall truckload volumes increased last month but the number of loads posted to the DAT One network fell 6.0% compared to May. This marked a shift from the spot market toward more freight moving under contract or other means.
- With fewer loads on the spot market and more trucks available, load-to-truck ratios declined for all three equipment types. The national average van ratio was 5.6 in June, meaning there were 5.6 available loads for every van posted to the DAT network, down from 6.1 in May. The reefer ratio was 11.6, down from 13.0, and the flatbed ratio slipped from 97.1 in May to 66.8 last month.
- Usually, 12 to 15% of all truckload volume moves on the spot market. Entering July, that figure is closer to 25% but should tighten as more shippers take a portfolio-based transportation procurement strategy (dedicated, contract and spot, as well as using a mix of both asset and non-asset providers).
- Between July 4 and Thanksgiving, weekly truckload volumes of produce typically decline an average of 21%, which translates to reefer carriers hauling 7,300 fewer truckloads per week by the end of November.