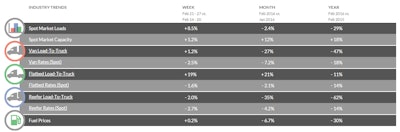
The number of loads on the spot market jumped 8.5 percent during the week ending Feb. 27, 2016 while available capacity rose 1.2 percent, according to DAT Solutions, which operates the DAT network of load boards.
Despite greater demand for truckload services, national average van, reefer, and flatbed freight spot rates all slipped compared to the previous week.
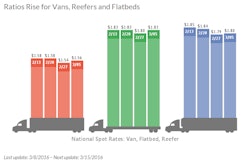
The number of van load posts increased 3 percent while truck posts gained 2 percent. The load-to-truck ratio held steady at 1.4 loads per truck, meaning there were 1.4 van loads for every truck posted on the DAT network. The national average van rate declined 4 cents to $1.54 per mile.
Reefer load posts fell 2 percent and truck posts were up less than 1 percent last week. As a result, the load-to-truck ratio slid 2 percent, from 2.9 to 2.8 loads per truck, while the national average reefer rate fell 5 cents to $1.79 per mile.
Flatbed load volume rose again, up 17 percent, while available capacity decreased 2 percent. That yielded a 19 percent increase in the national load-to-truck ratio, up from 10.6 to 12.6 loads per truck. The national average flatbed rate gave up 3 cents last week to $1.80 per mile.
Compared to January, spot market rates declined in February as the total number of posted loads fell 2.4 percent and available capacity rose 12 percent. Rates are expected to rebound seasonally in March.
The national average diesel price rose 1 cent to $1.99 per gallon.
Rates are derived from DAT RateView, which provides real-time reports on prevailing spot market and contract rates, as well as historical rate and capacity trends. All reported rates include fuel surcharges.
Load-to-truck ratios represent the number of loads posted for every truck available on DAT load boards. The load-to-truck ratio is a sensitive, real-time indicator of the balance between spot market demand and capacity. Changes in the ratio often signal impending changes in rates.
For complete national and regional reports on spot rates and demand, visit dat.com/Trendlines. DAT Trendlines is a weekly report on spot market freight availability, truck capacity, and rates.