Spot-market load availability fell 5.6 percent during the week ending Feb. 6, with the number of van and refrigerated loads dropping 17 percent and 12 percent, respectively, according to DAT Solutions, which operates the DAT network of load boards.
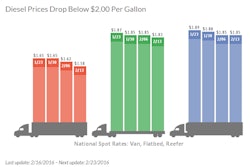
The combination of fewer posted loads and 2.5 percent more capacity helped hold rates down compared to the previous week. Declining fuel prices also played a role: diesel prices fell 3 cents to a national average of just under $2.01 per gallon, an 11-year low. Freight brokers usually quote a one-time rate that includes both the line-haul rate and the fuel surcharge.
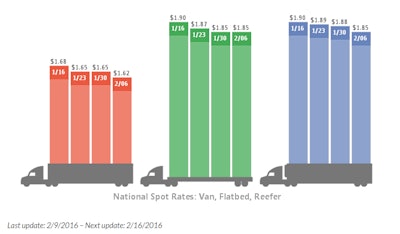
The national average van rate edged down 3 cents to $1.62 per mile, while the reefer rate fell 3 cents to $1.85 per mile. The average flatbed rate was unchanged at $1.85 per mile compared to the previous week.
Van load posts declined 14 percent while available capacity increased 4 percent, which sent the van load-to-truck ratio down 17 percent. The decrease from 1.7 to 1.4 loads per truck means there were 1.4 van loads for every van posted on the DAT network. In the reefer market, there were 11 percent fewer loads while truck posts added 1 percent. The load-to-truck ratio declined 12 percent from 3.8 to 3.4 loads per truck.
The spot flatbed freight market found some traction, with load volume up 6 percent against a 1 percent increase in capacity. That yielded a 6 percent increase in the flatbed load-to-truck ratio, from 8.3 to 8.7 loads per truck.
Rates are derived from DAT® RateView, which provides real-time reports on prevailing spot market and contract rates, as well as historical rate and capacity trends. All reported rates include fuel surcharges.
Load-to-truck ratios represent the number of loads posted for every truck available on DAT load boards. The load-to-truck ratio is a sensitive, real-time indicator of the balance between spot market demand and capacity. Changes in the ratio often signal impending changes in rates.
For complete national and regional reports on spot rates and demand, visit dat.com/Trendlines. DAT Trendlines is a weekly report on spot market freight availability, truck capacity, and rates.