As we approach 2030, when the climate pledges of many of the world’s largest food companies come due, there is a marked shift in how the food and agriculture industry is approaching supply chain mapping and carbon reduction. Many are now discovering that the hardest part isn't setting a target, but rather knowing how to measure your progress.
Scope 3 emissions, the indirect emissions generated from a company's supply chain rather than within its own operations, make up approximately 90% of a food company’s total climate impact.
That means that everything actually within a company’s control, including its facilities, fleet and energy usage, amounts to only a sliver of its corporate footprint. And the bulk of the problem – or, in some cases, the solution – lies in the company’s upstream sourcing. But these farms, solution providers and processors are the hardest to map.
You cannot reduce what you haven’t measured, and you cannot measure what you haven’t mapped. Supply chain mapping is the essential first step, but it’s a means to an end: accurate, ingredient-level carbon footprinting that can deliver actionable reduction insights.
The mapping hurdle: Why food and beverage supply chains are unique
In most sectors, supply chains are linear. In food and agriculture, they’re a complex, ever-shifting ecosystem. Mapping is notoriously difficult due to three primary volatility variables:
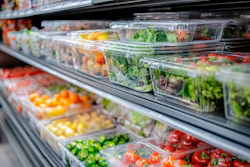
● Seasonality: Sourcing is a moving target. A distributor might source berries from Mexico in January and Michigan in July. Without mapping these shifts, carbon data remains a static (and often incorrect) average.
● Perishability: In food, data has an expiration date. If a supply chain map takes months to update, the product it was meant to track has already been consumed.
● Bulk aggregation: For ingredients like soy or palm oil, bulk aggregation often obscures the originating location and ignores farm-level nuances.
While these hurdles make mapping difficult, they make carbon footprinting even more critical. Emissions are not inherent to an ingredient; they are a function of how and where it is produced.
Why mapping is the foundation for emissions accuracy
Without a clear understanding of sourcing pathways, companies are forced to rely on industry average emission factors for their raw materials or even finished products. This creates invisible risk for sustainability and procurement teams.
On the other hand, carbon accounting at the ingredient level enables:
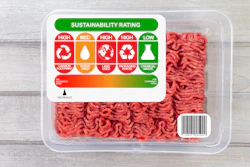
- High-fidelity footprinting: Using regional averages can misrepresent a product's impact by up to 50-100%. By measuring emissions for the specific supply shed or farm, you can apply higher-fidelity emission factors that reflect local soil health, fertilizer use, and land-use change.
- Effective reduction strategies: You cannot ask a supplier to reduce their footprint if you don't know their baseline. Granular data allows procurement teams to identify which specific ingredients and sourcing locations are driving the bulk of their emissions.
- Incentivizing better practices: When a company maps down to the farm level, they can reward suppliers who implement regenerative practices. Without this visibility, a farmer’s carbon-sequestering efforts are averaged out and lost in the bulk commodity pool, leaving little reason for them to make the investment in the first place.
Supply chain mapping and ingredient-level footprint transforms the supply chain from a black box into a lever for change. It turns carbon accounting from a compliance exercise into a competitive advantage.
From disclosures to decarbonization
The regulatory clock is ticking. With California’s SB 253 and the EU’s CSRD looming, large-scale food enterprises will be required to report Scope 3 emissions with documented data rather than global average estimates. Retailers and major brands are leading the charge on transparent reporting, forcing every manufacturer, solution provider and ingredient supplier to follow suit.
But the real value of granular measurement isn't avoiding legal risk. Rather, it’s about operational efficiency. When a company has a granular map linked to a carbon footprinting engine, they can run "what-if" scenarios: How would our footprint change if we moved our wheat sourcing from Kansas to North Dakota? What if we shifted 20% of our palm oil to a certified sustainable supplier?
The path forward
The path to Net Zero cannot be reached with opaque supply chains and global average emission factors. By investing in granular supply chain mapping, leading to ingredient-level product carbon footprinting, food companies can gain the insight they need to efficiently reach the targets they set out to hit.