A joint announcement made in June of 2024 by the USDA, EPA and FDA introduced aa national strategy intended to reduce the amount of food disposed of and wasted in the United States by 50% to help get food waste down to zero by 2030. This objective isn’t just a high-level policy goal, but rather a collaborative effort on the part of the government with established parameters to monitor the position of all businesses engaged in producing, processing, receiving or selling food products to the United States.
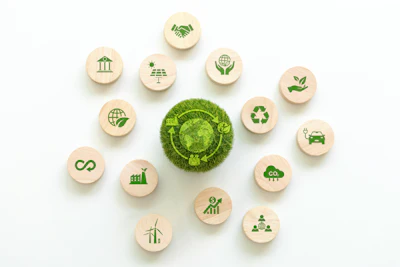
Sustainability is where it starts. And the initial starting point begins with mapping your supply chain.
What supply chain mapping actually means
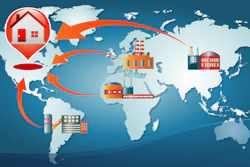
Supply chain mapping is the method of documenting every single node, flow, tier of suppliers and legs of logistics within a company's network. In the case of food logistics, this includes identification of where raw materials originate, where they're processed, cold chain hand-off points, transportation lanes to and from distribution centers and the last mile delivery routes. It means cataloging the data sources that exist at each stage: ERP systems, warehouse management systems, transportation management systems, IoT sensors on refrigerated trailers, and supplier portals.
This is a data integration challenge first and a sustainability tool second. The map is not just a static diagram. It’s a live, connected view of operations built by unifying data that already exists across dozens of systems and partners. Mapping is about connecting information so that decisions can be made with confidence.
The visibility gap is the waste gap
According to the FDA, between 30-40% of the U.S. food supply is wasted, which is an enormous amount. And it is driven in part by limited real-time access to the information required to measure the food waste they create as the result of spoilage, unsold products or excess inventory.
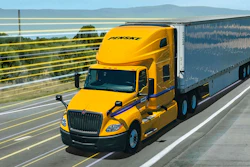
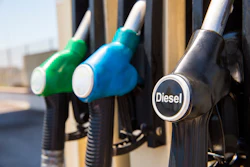
Consider what happens when a cold chain node fails. If a temperature excursion occurs during a handoff between a 3PL and a distribution center, and no one has visibility into that handoff in real time, the spoilage is discovered downstream. Product is discarded. Replacement shipments are expedited, burning additional fuel and generating additional emissions. The cost is financial, environmental, and operational, all at once.
This pattern repeats across many supply chains. Without a mapped, monitored view of each node, companies are managing by exception rather than by design. The visibility gap is often not a technology problem in most cases. It is a data architecture problem. The sensors and systems exist, but there isn’t a connected view.
Scope 3 disclosure is becoming mandatory for many organizations
California's Climate Corporate Data Accountability Act, known as SB 253, was signed into law in October 2023. It requires large companies doing business in California to disclose their Scope 3 greenhouse gas emissions. Scope 3 refers to the indirect emissions that occur across a company's value chain, not within its owned operations but upstream, in supplier factories, transportation networks, and distribution systems.
For food companies, Scope 3 emissions account for the majority of their total carbon footprint. Agriculture, processing, refrigerated transport and packaging all produce GHG emissions at every step of the supply chain but ultimately are out of the reporting company's direct control. SB 253 is forcing companies to build the data infrastructure needed to track these emissions across their supply chains.
In many cases, this infrastructure has not been fully developed. The regulatory requirement isn't asking companies to do something extreme. It's asking them to know what is happening in their own supply chains. The fact that many cannot answer that question reveals how deep the visibility gap runs.
The data already exists. It is just disconnected.
Many companies already have a significant portion of the data they need, but it lives in seven different systems that don’t talk to each other.
ERP platforms hold procurement and production data. Warehouse management systems track inventory and storage conditions. Transportation management systems contain shipment records and carrier performance. IoT devices monitor temperature, humidity, and location in real time. Supplier portals hold compliance documents and certifications. Each system serves its purpose well in isolation. Together, they should form a complete picture of the supply chain. In practice, they rarely do.
Research shows that sustainability performance measurement in food supply chains is constrained by the same data disconnection: companies struggle to measure what they cannot see across organizational boundaries.
The mapping challenge, then, is not about collecting new data, but about connecting existing data into a coherent, decision-ready view. This is where the real work lives, and it's where most organizations stall.
Map first, measure second, report third
Many companies are attempting to build sustainability reports before they have built supply chain maps. This sequence is often reversed.
The sequence matters. First, map the supply chain: document every node, every flow, every data source. Second, measure what the map reveals: emissions per lane, waste per facility, energy consumption per stage. Third, report with confidence, because the numbers are grounded in operational reality rather than estimates and assumptions.
Companies that skip the mapping step and jump straight to reporting produce documents that look credible but lack operational foundation. When regulators, investors, or customers ask follow-up questions, the answers fall apart. Worse, those reports can’t guide actual improvement because they are not connected to the systems where decisions get made.
The clock is running
The 2030 food waste reduction target is five years away. Implementation deadlines to comply with SB 253 have commenced. The regulatory environment is tightening, and the companies building their data foundations now will be the ones with the visibility to respond.
Leaders in food manufacturing are already embedding sustainability metrics into daily operations, tracking energy, water, and waste per SKU and per batch. They are building clean, connected data that supports future predictive capabilities.
The decision is increasingly time-sensitive. You can map your supply chain and build the foundation for credible sustainability progress, or you can keep writing reports about a supply chain you cannot actually see. The 2030 timeline leaves limited room for delay.