Recent hurricanes have made the evening news look like Hollywood climate apocalypse trailers. Hurricanes show the world what several feet of water in homes and businesses looks like. The billions of dollars in damages are staggering.
Yet we move on, telling ourselves these are random, low-probability, high-impact events. Meanwhile high-probability, relatively low-impact events such as tidal flooding are happening every week along the U.S. coast—sometimes 30 or more times a year at some locations on the East and Gulf coasts.
Events like these and the increasing flood frequencies and levels being experienced at the U.S. coast, as well as our reliance on global supply chains, prompt the question: What is the future flood risk to coastal ports on which so many of our supply chains depend?
While the tide gauges provide quantified evidence of current and past sea level, rise in sea level and flood history, a model is required to explore future sea level rise and flood levels. Fortunately, a peer-reviewed model shows excellent fidelity when run using historical data.
Climate Central combined the model with local flood history data from tide gauges to provide a probabilistic model for estimating future local flood events.
Using data from this model and a proprietary algorithm from Logistix Solutions, which mathematically correlates flooding estimates to port disruptions and lack of availability, the upstream and downstream dependencies on a port like Savannah can be determined, as well as alternative supply chain networks and possible future capital expenditures that can mitigate this risk.
Evaluation technique and analysis
The data evaluated future flood risks to ports by analyzing the docks, cargo areas, road and railway segments that contribute to the operational effectiveness of a port. After all, a port with high and dry docks cannot operate if goods and personnel cannot get in and out of the facility. Actual flood level and tide gauge data reported by National Oceanic and Atmospheric Administration are the basis for future projections of sea level rise and potential flood events.
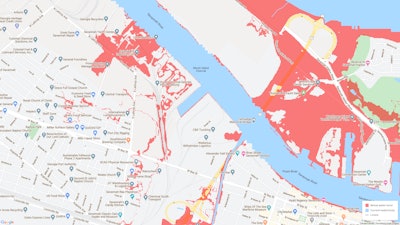
For instance, the map images are variations on two views—different zooms of annual flood risk zones in 2050 and risk zones by water level above the high tide line (measured at Fort Pulaski). The highest water level recorded at that station was in 2016 (Hurricane Matthew) at 4.95 feet above the high tide line. Also, the projected risk of an annual flood reaching 3 feet above the high tide line in 2020 is 20%. In 2030, that risk rises to 51%. In 2040, it's 93%. And, in 2050, it's 100%. The projected risk of an annual flood reaching 5 feet above the high tide line rises to 100% in 2090. So, Hurricane Matthew-level coastal flooding at the Port of Savannah is projected to be, on average, at least an annual event by then.
Using satellite images from Google Maps, Climate Control inspects ports and selects a number of representative docks, cargo areas, roads and rail segment locations.
A proprietary portfolio analysis tool uses location coordinates to look up elevation and sample thousands of potential sea level rise levels (from the probabilistic model) plus local flood history from the nearest tide gauge to estimate the number of expected annual flood events during specific years in the future.
Running the portfolio analysis tool assuming carbon emissions levels remain unchecked for locations chosen within the Port of Savannah.
These are expected annual flood events in the years 2020, 2030, and so on to year 2100. Locations with 1% annual chance flood values up to 10% annual chance flood values are shown in yellow; those above 10% up to 99% annual chance floods are shown in orange. Values greater than one, representing more than one expected flood event per year, are shown in red.
These data can then be converted into port capacity measures for each of the docks, road and rail elements to estimate the impact on future supply chain while optimizing future supply chain networks and using alternative ports and suppliers.
How climate change can impact you
Today’s supply chains are susceptible to innumerable challenges, including supplier disruptions, demand variability, inventory imbalances, competitors, pandemics such as the Coronavirus disease (COVID-19) and in the not so far off future, climate change and sea level rise. Unmitigated, sea level rise will affect ports worldwide and their ability to handle goods in transit throughout the inbound and outbound supply chain network.
Disruptions are not only or even primarily due to the sea level rise at the docks themselves, but more so due to flooding of surrounding infrastructure of roads, rail heads and supporting facilities in the vicinity of the ports.
All port authorities must develop medium and longer-term plans to deal with this issue, including investment, which will measure in the billions of dollars. By the same measure, companies that import or export products through these ports must plan for the inevitable disruptions caused by more frequent flooding events. And, companies must examine their current supply chains to evaluate their future investment in facilities and transportation and even sourcing policies.
Using resources like the ones that produced this assessment, supply chain analysts can determine alternatives that must be enacted today to safeguard against future calamities. Investments today in warehouses, distribution centers, port facilities and transport equipment must be evaluated with major impacts to be felt in the next few years.
Potentially dramatic impacts are sure to affect supply chains starting in 2030 with an accelerated pace, meaning more flooding events with increasingly significant impacts, from 2030 onward. But, there is technology and--at least for now--the time to prepare for those impacts.