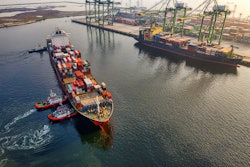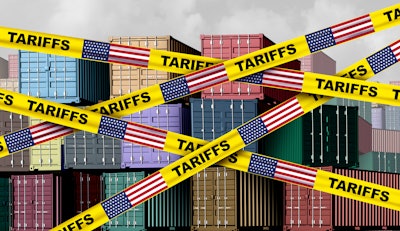
The “Liberation Day” tariffs, which went into effect on Aug. 7, represent the most wide-ranging tariff implementation in modern U.S. history. A wide range of duties, tracked in detail in project44’s tariff tracker, has created an uncertain and often volatile environment for global trade.
“One of the clearest indicators of this shifting landscape has been an increase in blank sailings throughout 2025, reflecting reduced demand for ocean capacity as the cost to import goods into the United States rises,” the report says. “These capacity cuts have been concentrated on certain lanes and carriers, particularly on U.S.-related trade routes most directly impacted by tariffs and geopolitical tensions. However, as tariff rates have mostly stabilized, new trends for U.S. trade are beginning to emerge.”
Key takeaways:
· Early trends include plummeting trade rates between the United States and China, an increase in U.S. imports from Thailand and Indonesia, and a 7.8% decrease in the proportion of U.S. exports going to Canada.
· In 2025, blank sailings data illustrates how carriers are responding to tariff-driven disruption in U.S. trade. Several U.S.-related trade lanes have seen significant increases in blank sailing rates compared to 2024, pointing to tighter capacity control and shifting service priorities.
· East Coast to South Asia has shown a 186% increase compared to this time last year, implying that capacity demand for U.S. exports to the region (which includes India, Pakistan, and Sri Lanka) are down.
· Asia to Canada blank sailings increased by 80%. Many of these vessels do have port calls in the United States before discharging in Canada, which can contribute to the increase in blank sailings here. Asia to the West Coast increasing by 18% also supports that demand of Asian goods into the West Coast has decreased throughout 2025.
· Lastly, there is a 60% increase in blank sailings from the West Coast to Europe, showing that the decreased demand for U.S. exports expands outside of only South Asia and is prevalent in Europe as well.
· Blank sailings between the United States and China continue to be a point of interest in global trade. Between January 2024 and late 2025, blank sailings on U.S.–China routes shifted from relatively stable patterns to sharp volatility.
· Throughout 2024, monthly cancellations generally ranged from 10–32 per direction, a steady but manageable level. That dynamic changed in 2025: blank sailings spiked in April–June, with a smaller increase again in September. Projections were even more aggressive for October, but with the possibility of 100% of additional tariffs, which were later cancelled when an agreement between the United States and China, carriers cancelled blank sailings to adjust for pull-forward demand. Going into November, planned blank sailings remain low.
· On the import side, shipments from China to the United States are trending 27% lower year-to-date compared to 2024. After modest gains in January (+1%) and February (+4%), volumes fell steeply and have remained 40% lower through October compared to 2024 volumes. These swings illustrate how tariffs and front-loading behavior created early-year increases followed by sustained weakness through the summer and fall.
· In response to the U.S. tariffs, China passed their own tariffs on U.S. goods, impacting exports from the United States to China.
· On the export side, shipments from the United States to China are under even greater pressure, trending 42% lower year-to-date. Monthly volumes have been consistently negative against 2024, with particularly steep drops of -57% in April, -53% in May, and -53% again in August, and -56% in October. Political tensions layered on top of tariff measures are compounding the downturn, reducing demand for U.S. goods in the Chinese market.
· Ocean shipment data, however, reveals early signs of resourcing trends. With volumes out of China decreasing, Indonesia and Thailand are emerging as alternative suppliers, with imports up 37% from Thailand and 34% from Indonesia year-to-date. Both countries still face tariffs (+19% since January, plus product-specific surcharges), but demand has nevertheless grown.
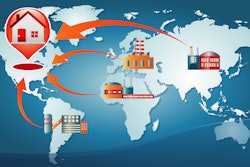
· While tariffs have reshaped certain trade lanes, the broader proportions of U.S. imports and exports by country have undergone modest changes in 2025. This suggests that, despite political and economic headwinds, most U.S. companies have not significantly restructured their sourcing or customer base.
· The de minimis exemption allowed packages entering the United States with a value of less than $800 to be exempt from tariffs and duties. This exemption was closed as of Aug. 29, so now all items entering the United States are subject to tariffs and duties regardless of value. This has led to an uptick in consumers in the United States being surprised by a tariff bill after a package was delivered and has created a need for an average consumer to have a higher awareness for where online orders are shipping from and what tariffs and duties they might incur. This has also led to an increase in work needed for e-commerce shippers to process shipments from overseas, with concerns that this will delay online orders in the e-commerce space.
“The 2025 tariff environment has created major volatility in U.S. trade, with blank sailings climbing sharply and trade between the United States and China reaching record lows. Imports from China are down 27% year-to-date and exports are down 42%. Capacity reductions are concentrated on key routes, including a 186% rise in blank sailings from the East Coast to South Asia and a 60% increase from the West Coast to Europe,” the data says. “At the same time, imports from Thailand and Indonesia have surged more than 30%, while exports to India and Mexico have grown modestly as companies diversify their trade partners. The end of the de minimis exemption added new processing burdens for carriers and consumers, but last-mile performance remained steady through October. Overall, tariffs, capacity cuts, and shifting trade relationships are reshaping global shipping patterns and prompting gradual changes in U.S. sourcing strategies.”