After rallying from May through September, spot truckload rates have plateaued as demand for trucks cooled during the week ending Oct. 18, said DAT Freight & Analytics, which operates the industry’s largest load board network.
Load-to-truck ratios, which measure the number of available loads relative to the number of trucks on the spot market, slipped for the second straight week. Still, spot rates remain high due to imbalanced networks and tight capacity on specific lanes and markets, and ratios are more than double what they were at this time last year.
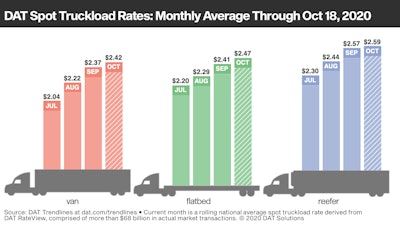
National Average Rates, October (through Oct. 18)
- Van: $2.42 per mile
- Flatbed: $2.47 per mile
- Refrigerated: $2.59 per mile
These are national average spot rates for the month through Oct. 18. Rates will vary from load to load and lane to lane.
Trendlines
Demand edges downward
National average load-to-truck ratios were softer last week as the number of load posts on the load board network declined 3% while truck posts slipped 2%. The van ratio was 4.2, unchanged from the previous week and the reefer ratio slipped from 8.7 to 8.3. The flatbed ratio was 37.2, down from 38.9.
Rates dip from highs
Spot market van rates were flat last week, pulling the monthly average down a penny to $2.42 a mile including fuel. The average spot rate was higher on 22 of DAT’s top 100 van lanes by volume compared to the previous week. Twenty-three lanes were neutral and 55 saw rates decline. The number of available loads on these lanes dipped 1.4% week over week.
The national average reefer rate has been in a tight 4-cent band for the last four weeks. Among DAT’s top 72 reefer lanes by volume, 23 were up, 19 down, and 30 unchanged, with the number of loads moved on those lanes up almost 1% compared to the previous week. Rates were better for flatbed freight. Of DAT’s 78 highest-volume flatbed lanes, 30 were up, 17 down, and 31 unchanged on a 0.7% gain in volumes.
Hot commodities
In general, several types of freight affected by supply chain imbalances continue to pay well:
- Van: FAK (freight all kinds), which includes e-commerce and retail, is up 33 cents a mile over the national average.
- Reefer: Food is running 22 cents a mile higher than the national reefer average, and beverages are up 13 cents a mile.
- Flatbed: Building materials are 4 cents a mile over the national flatbed average. Housing activity remains especially strong in the Southeast.
Ahead of Thanksgiving, reefer volumes are rising out of poultry markets. Roughly 63% of turkey production comes from just five states: North Carolina, Minnesota, Indiana, Missouri, and Arkansas.
E-commerce freight drawing capacity
According to the U.S. Bureau of Labor Statistics, employment at local trucking companies increased 7.4% between its low point in April and July, the last month for which data are available. Long-distance trucking employment hit its low in May and rose just 1.3% from then through July. Compared with July 2019, unadjusted long-distance trucking employment was down 6.4%. A shortage of qualified drivers may in part explain record levels of spot market activity where asset-based carriers have been unable to meet their contracted commitments on existing lanes.