The 2026 MHI Annual Industry Report found that 41% of respondents currently use artificial intelligence and another 47% expect to adopt it within five years. The same report found that 42% identified supply chain synchronization and visibility as a major challenge, while another 44% called it a minor challenge.
Those findings describe a familiar problem in food and beverage warehouses. Adoption is increasing across operations that already generate large volumes of information from lift trucks, chargers, maintenance systems and safety technologies. Multi-shift schedules, cold storage requirements, seasonal volume spikes and uptime-sensitive workflows add operational pressure. A truck taken out of service at the wrong time can affect production support or delay a temperature-sensitive shipment.
So how then do managers move from simply collecting more fleet data, to connecting and interpreting the information they already have, to make better decisions?
Create a connected view of warehouse fleet performance
Utilization, safety, maintenance and energy records are often reviewed in separate systems. That segmentation can obscure the relationship between equipment demand and availability. A manager may see that a truck is approaching a maintenance interval unusually fast, without seeing that it has also logged unusually high hours in a freezer. Charging records may show normal activity across the fleet while trucks assigned to receiving repeatedly begin a shift without sufficient charge.
Bringing these records into one view allows teams to compare equipment use by shift, operating area or seasonal production period. The comparison can identify trucks that are used far more or less than similar equipment. It can also help managers determine whether downtime is associated with heavy use, delayed service or a charging conflict. Safety records add another dimension by showing whether impact events recur near a specific doorway, staging area or aisle.
This combined information supports specific decisions. Managers can reassign available equipment, schedule service around production requirements or adjust charging times before a peak period. They can also evaluate whether a local shortage reflects fleet size or the way equipment is distributed across the facility.
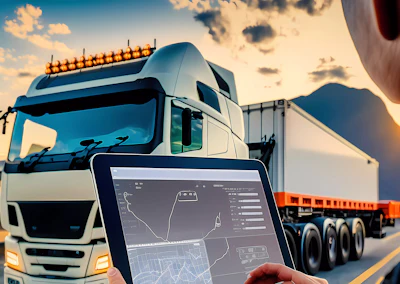
Most platforms illustrate this centralized approach by bringing safety, service, utilization and energy records from warehouse material handling equipment into one view.
Make fleet data accessible through AI
The MHI report indicates that companies are pursuing practical AI applications. Among current or anticipated uses of AI within two years, 30% of respondents cited predictive maintenance and equipment reliability, while 27% cited automating operational decision-making.
Natural-language tools can make connected fleet records easier for operations managers to use. A manager could ask which lift trucks had the highest utilization last week, where impact events occurred most frequently, which equipment is approaching a maintenance interval or how utilization varied by shift. The system can locate the relevant records and organize the results as a direct answer, table or visualization. This reduces the need to navigate several menus or build a custom report for each question.
Use connected records to support safer operations
Food and beverage facilities often require people and lift trucks to work in shared spaces around dock doors, cold-room entrances and staging areas. Reviewing safety events with equipment, location and time data can reveal patterns that individual alerts do not establish. Repeated events at the same location may justify a review of sightlines, traffic routing or pallet staging. Comparing event records after a change helps the safety team determine whether conditions improved.
Prepare for mixed warehouse environments
Food warehouses are adding automated systems while manually operated equipment remains in service. Lift trucks, pallet jacks, reach trucks and order pickers from multiple manufacturers may operate alongside conveyors or automated guided vehicles, often across ambient and temperature-controlled areas. Each system may produce its own records and use different reporting formats.
A connected platform should accommodate the equipment already in service and allow additional systems to be integrated over time. Managers need consistent fields for equipment identity, assigned area, operating hours, service status and energy use. A centralized view becomes more useful as the number of data sources grows because it allows staff to evaluate fleet performance across the facility without checking a separate portal for every equipment type.
Move from information to action
The objective is to give warehouse teams an accurate view of fleet performance and enough time to respond. Effective programs begin with one recurring decision, such as improving equipment availability for a shift or reducing unplanned downtime during peak receiving. The team can establish a baseline, connect the records required for that decision and assign responsibility for reviewing the result.
Food and beverage material-handling fleets already create records of equipment use, service needs, energy consumption and safety events throughout each shift. Bringing those records together and making them easy to understand can help managers act before an equipment issue affects production schedules or customer shipments.
The value of fleet data is measured by the decisions it improves before the next shift begins.