When new federal hours of service regulations took effect on July 1, 2013, the intent was to reduce fatal crashes on the highway. Whether that’s actually happening is another subject altogether, but there’s little doubt that the rules have hindered productivity and led to higher rates for anyone who ships freight over the road.
The most contentious rule change involves the 34-hour restart. Drivers are allowed to “restart” their 60- or 70-hour service clock after having at least 34 consecutive hours off duty. The rule now requires the restart period to include at least two off-duty periods from 1 a.m. to 5 a.m. (home-terminal time zone). Furthermore, the use of the restart is limited to once a week (once every 168 hours).
These twists on the restart provision tend to put a disproportionate share of trucks on the road in major metro areas during morning rush hours. Furthermore, drivers who are accustomed to working nights are forced to re-set their schedules during their off-duty hours, disrupting normal sleep patterns. Also, timing mandatory breaks can be tricky for long-haul drivers who are on tight timetables and may have trouble finding safe and legal parking spots at precise intervals.
HOS and Higher Rates
What has this meant for supply chains? A survey from the American Transportation Research Institute (ATRI) found that 80 percent of carriers lost productivity due to the HOS changes, with 50 percent noting that they need more drivers to maintain the status quo in terms of freight-hauling capacity.
ATRI analyzed 40,000-plus driver logbook and concluded that the new rules result in a loss of 7.5 minutes to 30 minutes per week per driver. This equates to a cost of $95.06 million to $376.94 million per year, as well as a net loss of $1.6 billion in driver compensation.
Carriers naturally want to recover these costs, and they’re making gains. Charting our data at DAT, we can see how an HOS-induced productivity loss corresponded with increased rates.
Let’s go back to the third quarter of 2013, just after the new rules took effect. Instead of sharp Q3 decline, spot market van rates (the orange line) rose and remained elevated through the third quarter. At the end of Q4, these rates rose even further to a peak in March 2014 when severe weather constrained truckload capacity.
Rates reached a high again in June, when truckload freight volume on the spot market was up 50 percent compared to the previous year. In July, freight volume increased 40 percent for vans, 28 percent for reefers, and 52 percent for flatbeds year-over-year. The increased demand, together with capacity constraints, caused national average spot market truckload rates to rise year-over-year for all major equipment types: the van rate rose 15 percent, the refrigerated rate was up 6.3 percent, and the flatbed rate rose 15 percent compared to July 2013.
Van rates follow closely behind trends in the load-to-truck ratio (purple line), an indicator of demand versus available spot-market capacity. For the month of August, the average van load-to-truck ratio was 3.3, meaning there were 3.3 available loads for every available van posted on DAT load boards. That’s a 5.2 percent increase compared to July, and 25 percent above the level of August 2013.
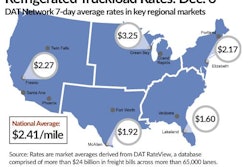
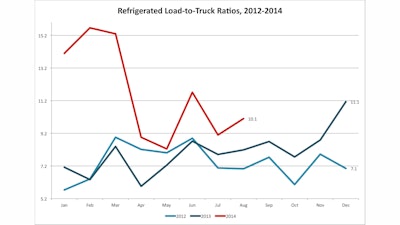
Now let’s look at capacity and demand for refrigerated freight. The load-to-truck ratio for August was 10.1, a sharp 11 percent jump from July and 24 percent higher compared to August 2013. Typically, reefer load-to-truck ratios flatten out or rise slightly in August before making an autumn decline. At a national average of $2.28 per mile in August (including a fuel surcharge), spot rates remained strong for reefers through the summer, exceeding August 2013 averages by 9.1 percent.
What Next?
In the short term, the Christmas freight season is not far off and consumer confidence is up, which means there will be “exception” freight—goods that aren’t under contract—possibly lots of it.
With demand increasing, and carriers and drivers having to keep a more watchful eye on the HOS clock, spot market rates have continued to rise. As a forecasting tool, spot market rate trends are a valid indicator of where contract rates will go. Anticipate an increase starting with the Q1 bidding season.