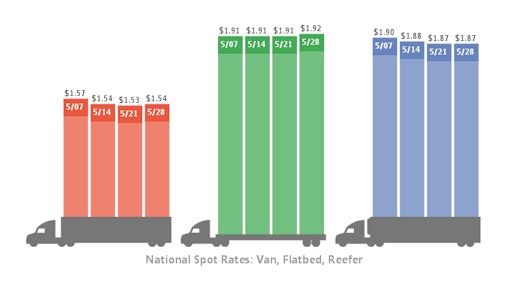
National average truckload van and flatbed rates each rose a penny on increased demand for capacity during the week ending May 28, according to DAT Solutions, which operates the DAT network of load boards. An 8.5 percent increase in the total number of available spot loads and higher diesel prices also played key roles in the spot rate picture.
The number of posted reefer loads increased 19 percent as available capacity declined 5 percent, compared to the previous week. The result was a 4.1 reefer load-to-truck ratio, a 25 percent increase.
The national average reefer rate was unchanged at $1.87 a mile despite a seasonal increase in demand.
The number of available van loads jumped 16 percent while the number of vans was unchanged last week. The van load-to-truck ratio gained 16 percent to 1.9 loads per truck.
At $1.54 per mile, the national average van rate rose 1 cent. Rates rose sharply on many high-volume lanes, however. By region, leading markets for average outbound spot rates include:
- West: Los Angeles, $2.01/mile, up 8 cents
- Midwest: Chicago, $1.74/mile, up 4 cents
- South Central: Dallas, $1.50/mile, up 2 cents
- Southeast: Charlotte, $1.82/mile, up 3 cents
- Northeast: Allentown, Pa., $1.80/mile, up 2 cents
Flatbed load availability dipped 0.5 percent while capacity increased 8 percent last week. That led to an 8 percent decrease in the flatbed load-to-truck ratio at 14.2 loads per truck. The national average flatbed rate increased 1 cent to $1.92 per mile.
Rates are derived from DAT RateView, which provides real-time reports on prevailing spot market and contract rates, as well as historical rate and capacity trends. All reported rates include fuel surcharges.
Load-to-truck ratios are a sensitive, real-time indicator of the balance between spot market demand and capacity. Changes in the ratio often signal impending changes in rates.
For complete national and regional reports on spot rates and demand, visit dat.com/Trendlines. DAT Trendlines is a weekly report on spot market freight availability, truck capacity, and rates.