What factors should a food distribution organization pay attention to in order to maximize efficiencies, improve customer service and boost profitability? The question lends itself to an extensive discussion among distribution professionals, as evidenced by an interactive seminar during the International Foodservice Distributors Association distribution conference at the Indiana Convention Center in Indianapolis.
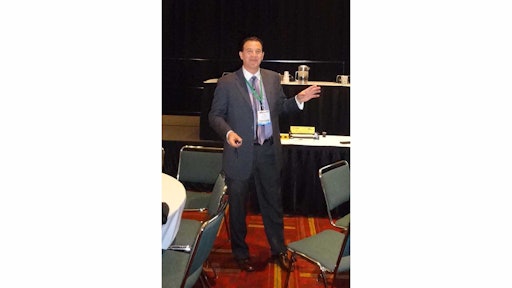
Tony Vercillo, Ph.D., president and CEO of IFMC consultants, offered his insights on what metrics to use to lower the cost of distribution. A key theme that emerged from his presentation was the need to understand that all costs are variable and he urged distributors to adopt a “variable cost mentality.”
Early in the presentation, Vercillo identified the following top 12 distribution challenges: 1) Intense competition; 2) The application and integration of technology; 3) Sustainability; 4) Cost-to-serve modeling; 5) Inventory planning, control and velocity; 6) Demand forecasting; 7) Supply chain design and optimization; 8) Doing more with less (less staffing, less capital, etc.); 9) Exceeding customer expectations; 10) Rising freight and truck costs; 11) Driver shortages; and 12) Best use of capital.
The most important cost drivers for distribution Vercillo noted are:
- Fixed costs (depreciation, resale value)
- Miles (route structure)
- Capacity (cube, configuration)
- Weight (load out, minimum order quantity)
- Utilization ( percent utilization, hours per day)
- Labor and productivity (drivers, stops)
- Time (on time delivery, order cycle time, delivery frequency)
Vercillo stressed the need for distribution companies to know what factors they need to focus on. He urged distributors to adopt a “variable cost mentality” since all costs are variable.
While a fleet manager wants to retire fixed costs as soon as possible, fixed costs are not the same as actual costs, he said. “The older the fleet, the more likely your operating costs are going up, even though your fixed costs are going away,” he said.
Older vehicles have less resale value than newer ones, he noted. “Understanding life cycle is very important part of delivery costs,” he said.
The key questions a company should ask about the delivery fleet are:
1) What is the average age of the fleet (tractors, trucks, trailers)?
2) What is the life cycle replacement policy?
3) What is the shortest distance for each route?
4) Is there an engine idle-time tracking process in place?
5) Is fuel purchased as smartly and cheaply as possible?
6) Are the vehicles optimally spec’d for weight and fuel economy?
7) Are drivers incentivized for improving MPG’s?
8) Is there a weight/cube maximization program in place?
9) Is trailer configuration optimized to maximize cube?
10) Is cube/weight tracked by load?
11) Is on-board technology used to track driver productivity?
12) What is the exact percent utilization for each vehicle in hours?
13) Do I track on-time delivery to customers (not on-time dispatch)?
14) What is delivery frequency and minimum order size?
“Am I maximizing my weight of every load I send out?” Vercillo asked, noting the importance of weight/cube maximization.
Improving the proper amount of product on-time ranks as a high priority for food distribution organizations. Hence, this is a metric that companies pay attention to. While this is an important metric, organizations have to be aware of what costs are involved in changing this metric, Vercillo said.
Frito-Lay Inc. has carefully analyzed what its in-stock availability needs to be while maximizing customer service and minimizing cost. The company chose not to be 100 percent since they want to minimize cost while improving service, Vercillo said.
Vercillo then presented the “Balanced Scorecard,” which shows the relations among four areas of performance: 1) financial, 2) customer, 3) internal business processes and 4) learning and growth. Using the Balanced Scorecard, a company can rank its performance in meeting objectives, measures, targets and initiatives.
Distribution companies need a Balanced Scorecard consisting of three financial indicators (cost per unit, cost as a percent of sales and cost per mile), three customer service indicators (on-time delivery, in-stock percent and errors percent), three productivity related indicators (cases per hour, order cycle time and delay time) and three future value indicators (return on investment, return on costs and return on assets).
Once these performance indicators are determined, the company can have a simple, one-page “Executive Information Summary” (EIS) report for distribution measures.
Distribution metrics need to be specific, measurable, achievable, reasonable and time-phased, Vercillo said.
The most critical distribution metrics are: cost as a percent of sales, inbound freight as a percent of cost of goods sold, cost per unit or case, cost per cube, cost per mile, fuel as a percent of total distribution expense, depreciation as a percent of total distribution expense, on-time delivery (plus or minus 30 minutes), total order cycle time, and driver labor as a percent of total distribution cost.
Every Monday morning, the distribution manager should expect a report from finance of the essential measures that truly drive the business so that when they “push one button, there is a corresponding positive impact on results.” At minimum, the EIS should track cost as a percent of sales, cost per cube or cost per unit, and customer satisfaction.
Vercillo noted that his metrics are very detailed but the details are very important. While he identifies cost as a percent of sales as important, this metric is not the same as cost per mile, a metric that is often used by companies.
As the miles a truck operates increases, the cost per mile will decrease, he noted. However, the driver income tends to increase as miles are driven. Vercillo presented a chart showing that for a truck with a $1.06 cost per mile, at 50,000 miles the vehicle cost of $53,000 and a driver income of $22,174. The final $0.69 per mile cost for 130,000 miles represents a vehicle cost of $89,000 and a driver income of $38,422.
For information on key distribution metrics, readers can contact Vercillo at 310-498-7991 or via email at [email protected].
Elliot Maras is managing editor of Food Logistics Magazine.


