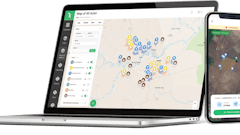
Vusion, a division of PeopleNet and a Trimble company that optimizes performance and decision-making through data integration and analytics, recently announced the launch of its MPG Analytics Dashboard at the Truckload Carriers Association annual convention in Grapevine, Texas.
“Collecting and analyzing data that impacts fuel use is critical for identifying areas that can be improved, as well as making vehicle buying/trading decisions," said Vusion President Tom Fansler. "Our new dashboard visually displays information, making analytics practical and actionable by emphasizing issues that need addressing via red alerts on what we call a heat map.”
Florilli Transportation, a 220-truck fleet based in West Liberty, Iowa, has been using the dashboard in conjunction with PeopleNet.
“Using Vusion’s MPG Analytics Dashboard, we are just a couple clicks away from the MPG data that previously took us hours or sometimes days to compile,” said Florilli Transportation Founder and CEO Murray Fitzer.
Vusion’s MPG Analytics Dashboard connects and interprets, and depicts data from multiple, relevant sources: the engine control module (over-speed, over-RPM, idle time, excess-speed), GPS (temperature, topography), dispatch (load weight), vehicle (vehicle age, engine size, make and model) and fuel purchases. Visual comparisons make it easy for management to see a true picture of each vehicle, each engine, and each driver, and how each performance factor directly impacts fuel economy.
According to Fansler, “This ensures that fleets are taking full advantage of their technology investment, and not missing insights by relying on isolated data sources. The dashboard provides an integrated, flexible view on performance, summarizing results at a fleet, driver manager, driver and vehicle level.”
Vusion’s dashboard allows fleets to customize configurations for its heat map (red and yellow alerts), asset groups and timeframes (day ranges). In addition, the dashboard displays behaviors specific to each driver and peer referencing as a context for coaching.
To read more, click HERE.